How to properly summarize a Rollup?
Often, for our tasks, we use various, yet interconnected, databases. Sometimes this is done to logically separate work processes, and other times because we need to set different levels of access.
Let’s consider the example of two databases:
- Finance (accessible only to administration),
- Departments (accessible to different company departments).
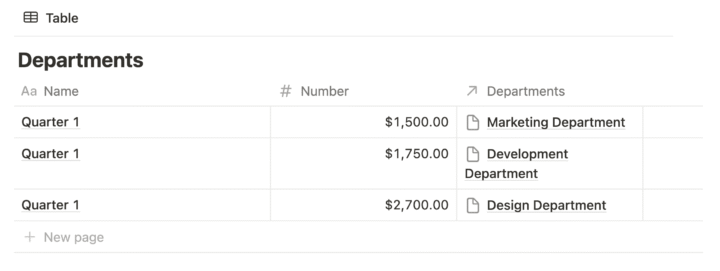
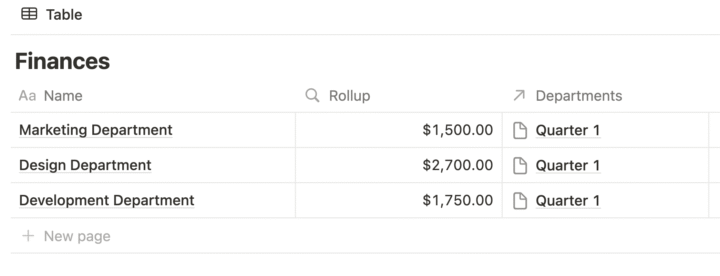
In the “Departments” database, different teams input their financial indicators for the quarters, while in the “Finance” database, the administration sees the consolidated statistics. For this, we have set up a Rollup in “Finance,” which pulls the financial data based on the relation property
Now, let’s take a closer look at when and why Rollup might not work.
What’s the Problem?
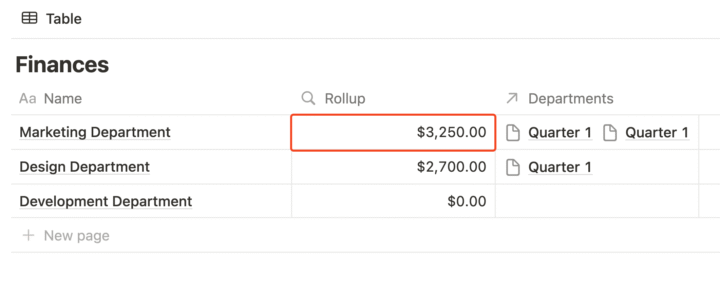
For example, we have 3 indicators for the 1st quarter — one from each department.
Here’s how this data will look in the “Finance” database.
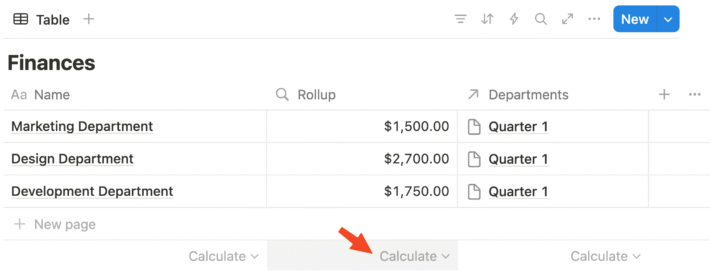
But if we want to summarize this column, we won’t be able to do so, because that option is simply unavailable.
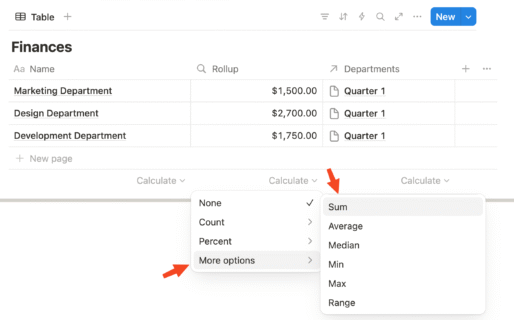
Here’s how it looks right now:
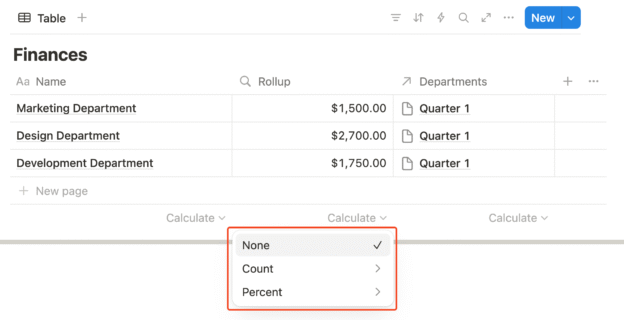
And here’s how it should look when there’s the possibility to summarize:
Why Can’t We Summarize the Indicators?
The inability to summarize financial indicators arises because the data coming into the “Finance” database isn’t individual units but an array of data. There is such a concept as array — a collection of data items that are transmitted as a single unit (let’s refer to it as a list for convenience).
And while it’s a list of data, you can’t combine its elements with others individually. This is because the list functions as an independent unit.
Let’s look at a specific example. Imagine the marketing department has two indicators, say, for two quarters.
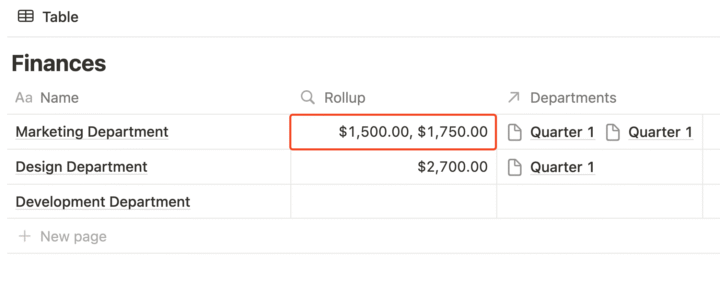
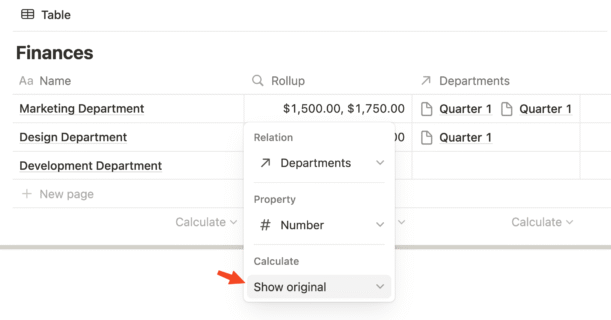
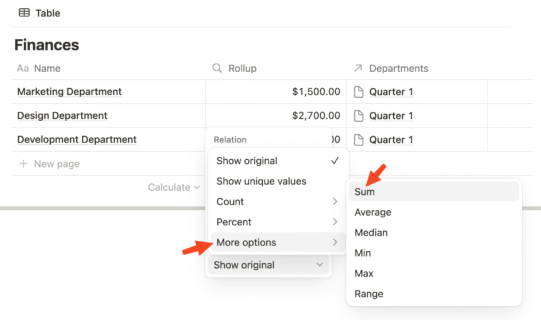
As you can see, these financial data points didn’t merge; they are placed next to each other. And at this point, it’s a list. To sum these indicators, we need to go inside the Rollup and select sum.
Now we’ve obtained the sum of these numbers.
That is, we turned the list into a unit.
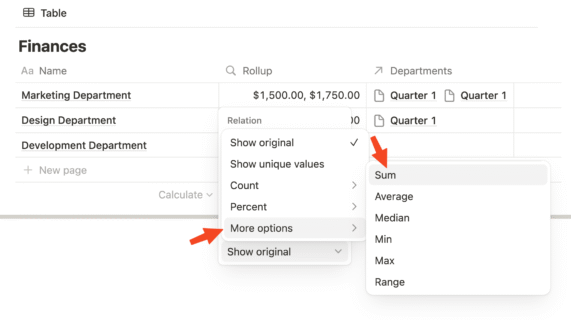
Therefore, just like here in the first example, even if you’re getting a single indicator rather than several, you still need to replace “Show Original” with “Sum.”
And now, as you can see, we have the option to sum the entire column.
Conclusions
This example will help you better understand what constitutes a data unit in Notion and what constitutes a list (Array). And this will definitely be useful when you start working more actively with Notion formulas, such as map(), filter(), find(), and others.